What is America's favorite state?

Xavi Brianso // Shutterstock
What is America’s favorite state?
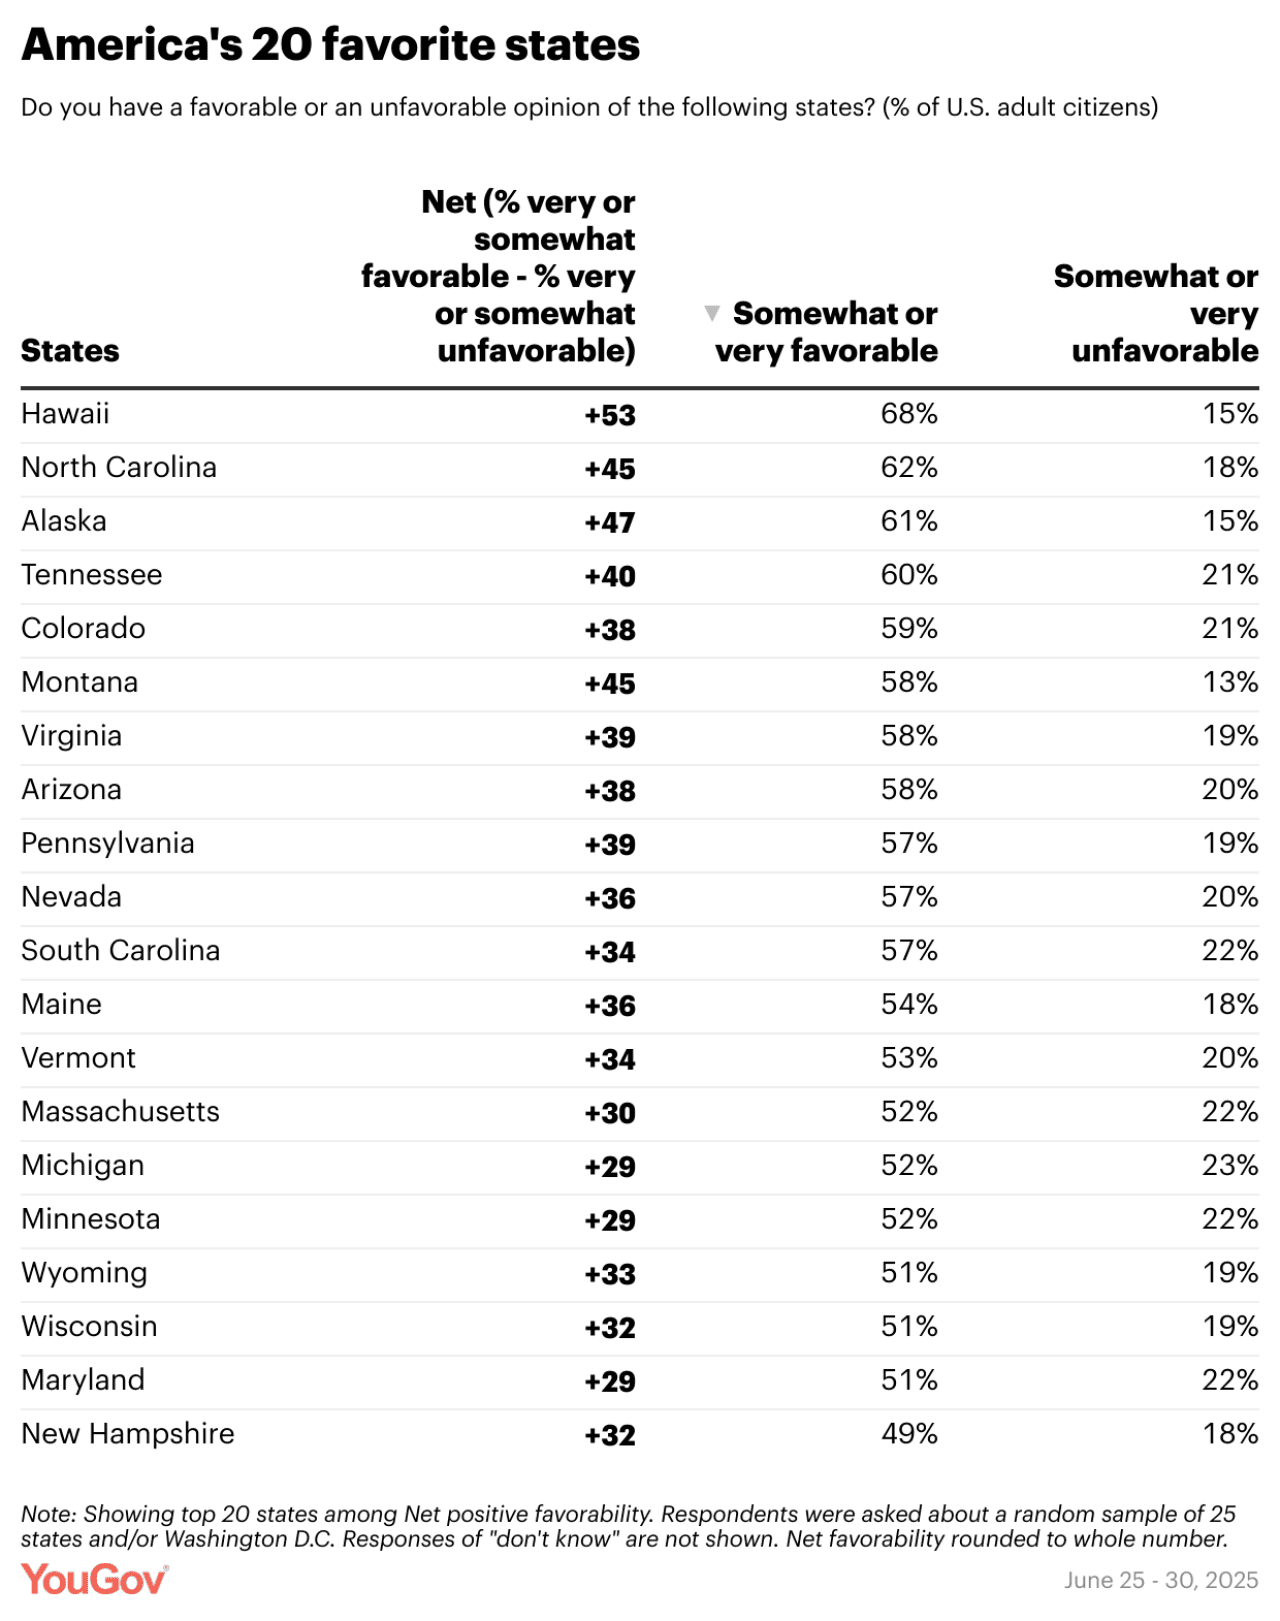
Hawaii is America’s favorite state in 2025, according to a new YouGov survey that asked 2,000+ Americans which states they view most and least favorably. Meanwhile, fewer Americans have a favorable view of Washington, D.C. than of any state.
Hawaii leads the 50 states both in the share of Americans who view it very or somewhat favorably (68%) and in the percentage who view it very favorably (36%).
Following Hawaii in the favorability rating are North Carolina (62%), Alaska (61%), Tennessee (60%), and Colorado (59%). Hawaii also leads every other state in net favorability — the share of Americans who view it favorably minus the share who view it unfavorably. Hawaii’s +53 net favorability leads Alaska (+47), Montana (+45), and North Carolina (+45).
Only 37% of Americans have a favorable opinion of the District of Columbia, behind the least-popular states of Mississippi (38%) and Rhode Island (44%). 36% of Americans view Washington, D.C. unfavorably and the net favorability of the nation’s capital (+1) also is lower than that of every state.
“While Washington, D.C. is a very popular tourist destination, many Americans view it through a political lens,” says Carl Bialik, VP of Data Science and U.S. Politics Editor at YouGov. “This likely contributed to the nation’s capital having a lower net favorability score than all 50 states.”
YouGov
While 19% of Americans have very unfavorable views of Washington, D.C., more do for California (25%) and Alabama (20%). New York and Florida are viewed very unfavorably by 19% each.
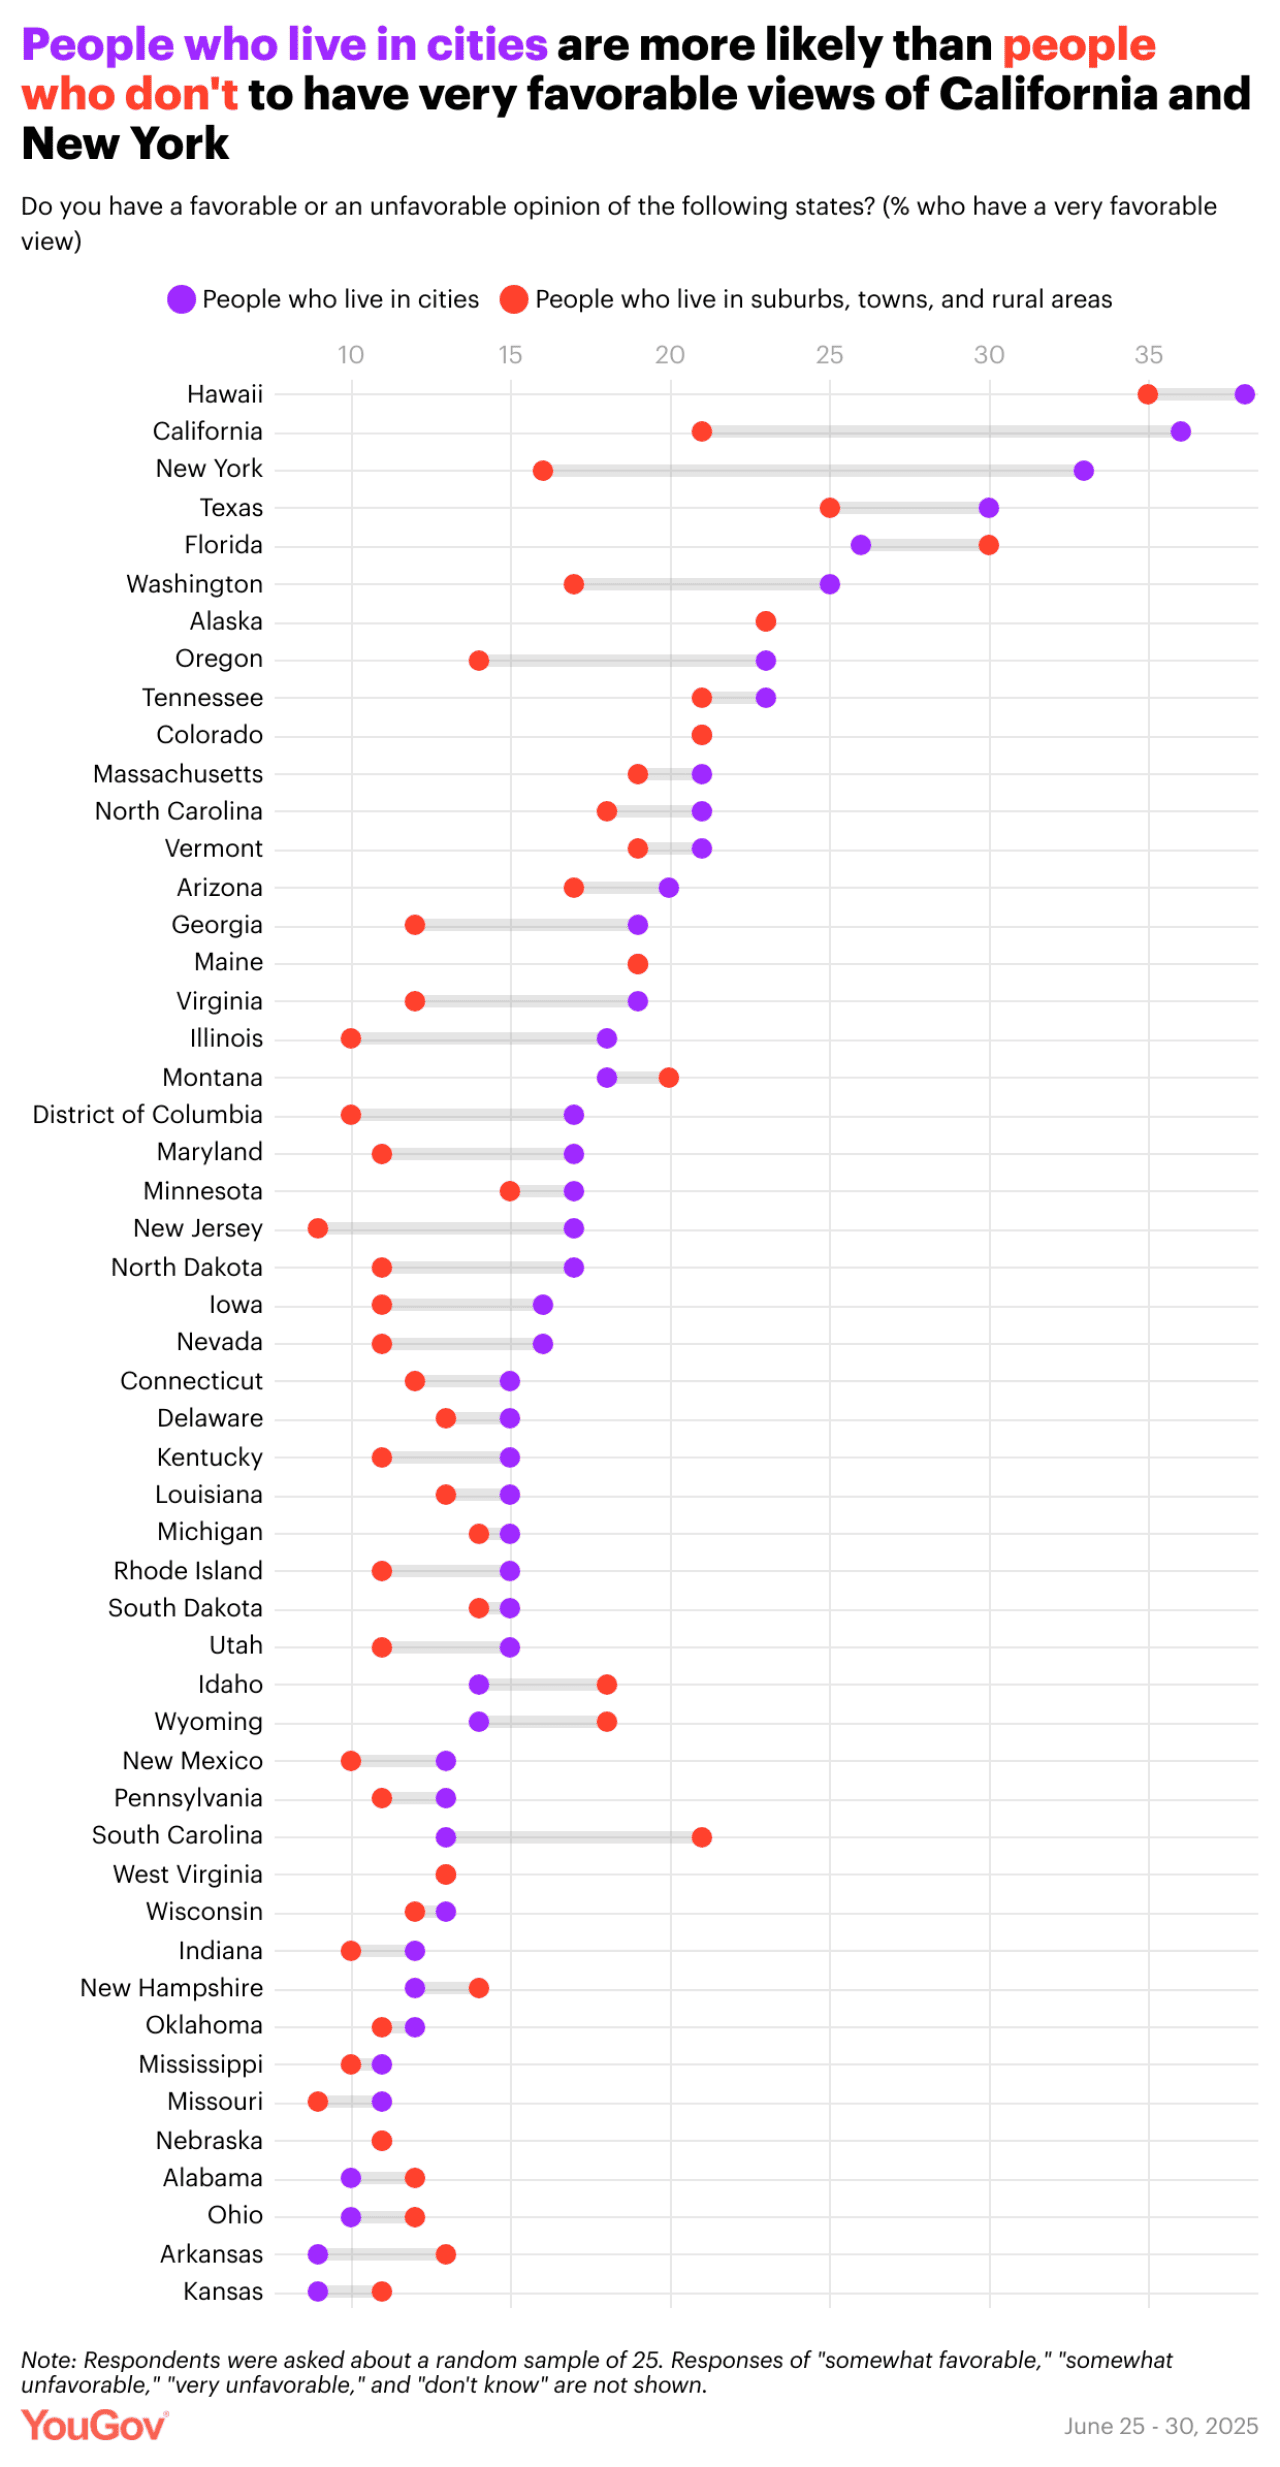
Among people who live in cities, 38% have a very favorable view of Hawaii. 36% have a very favorable opinion of California, and 33% have a very favorable opinion of New York. Among people who live in suburbs, 43% have a very favorable opinion of Hawaii and 30% have a very favorable opinion of Florida. Slightly fewer have very favorable opinions of Alaska (25%) and California (25%). People who live in towns are most likely to have very favorable opinions of Texas (32%), Florida (30%), and Montana (28%). The states that are viewed very favorably by the greatest shares of Americans who live in rural areas are Florida (29%), Texas (27%), South Carolina (26%), and Tennessee (26%).
YouGov
The state that city dwellers are most likely to view very unfavorably is Alabama (27%). California is the state seen very unfavorably by the largest shares of people who live in suburbs (27%), towns (30%), and rural areas (28%).
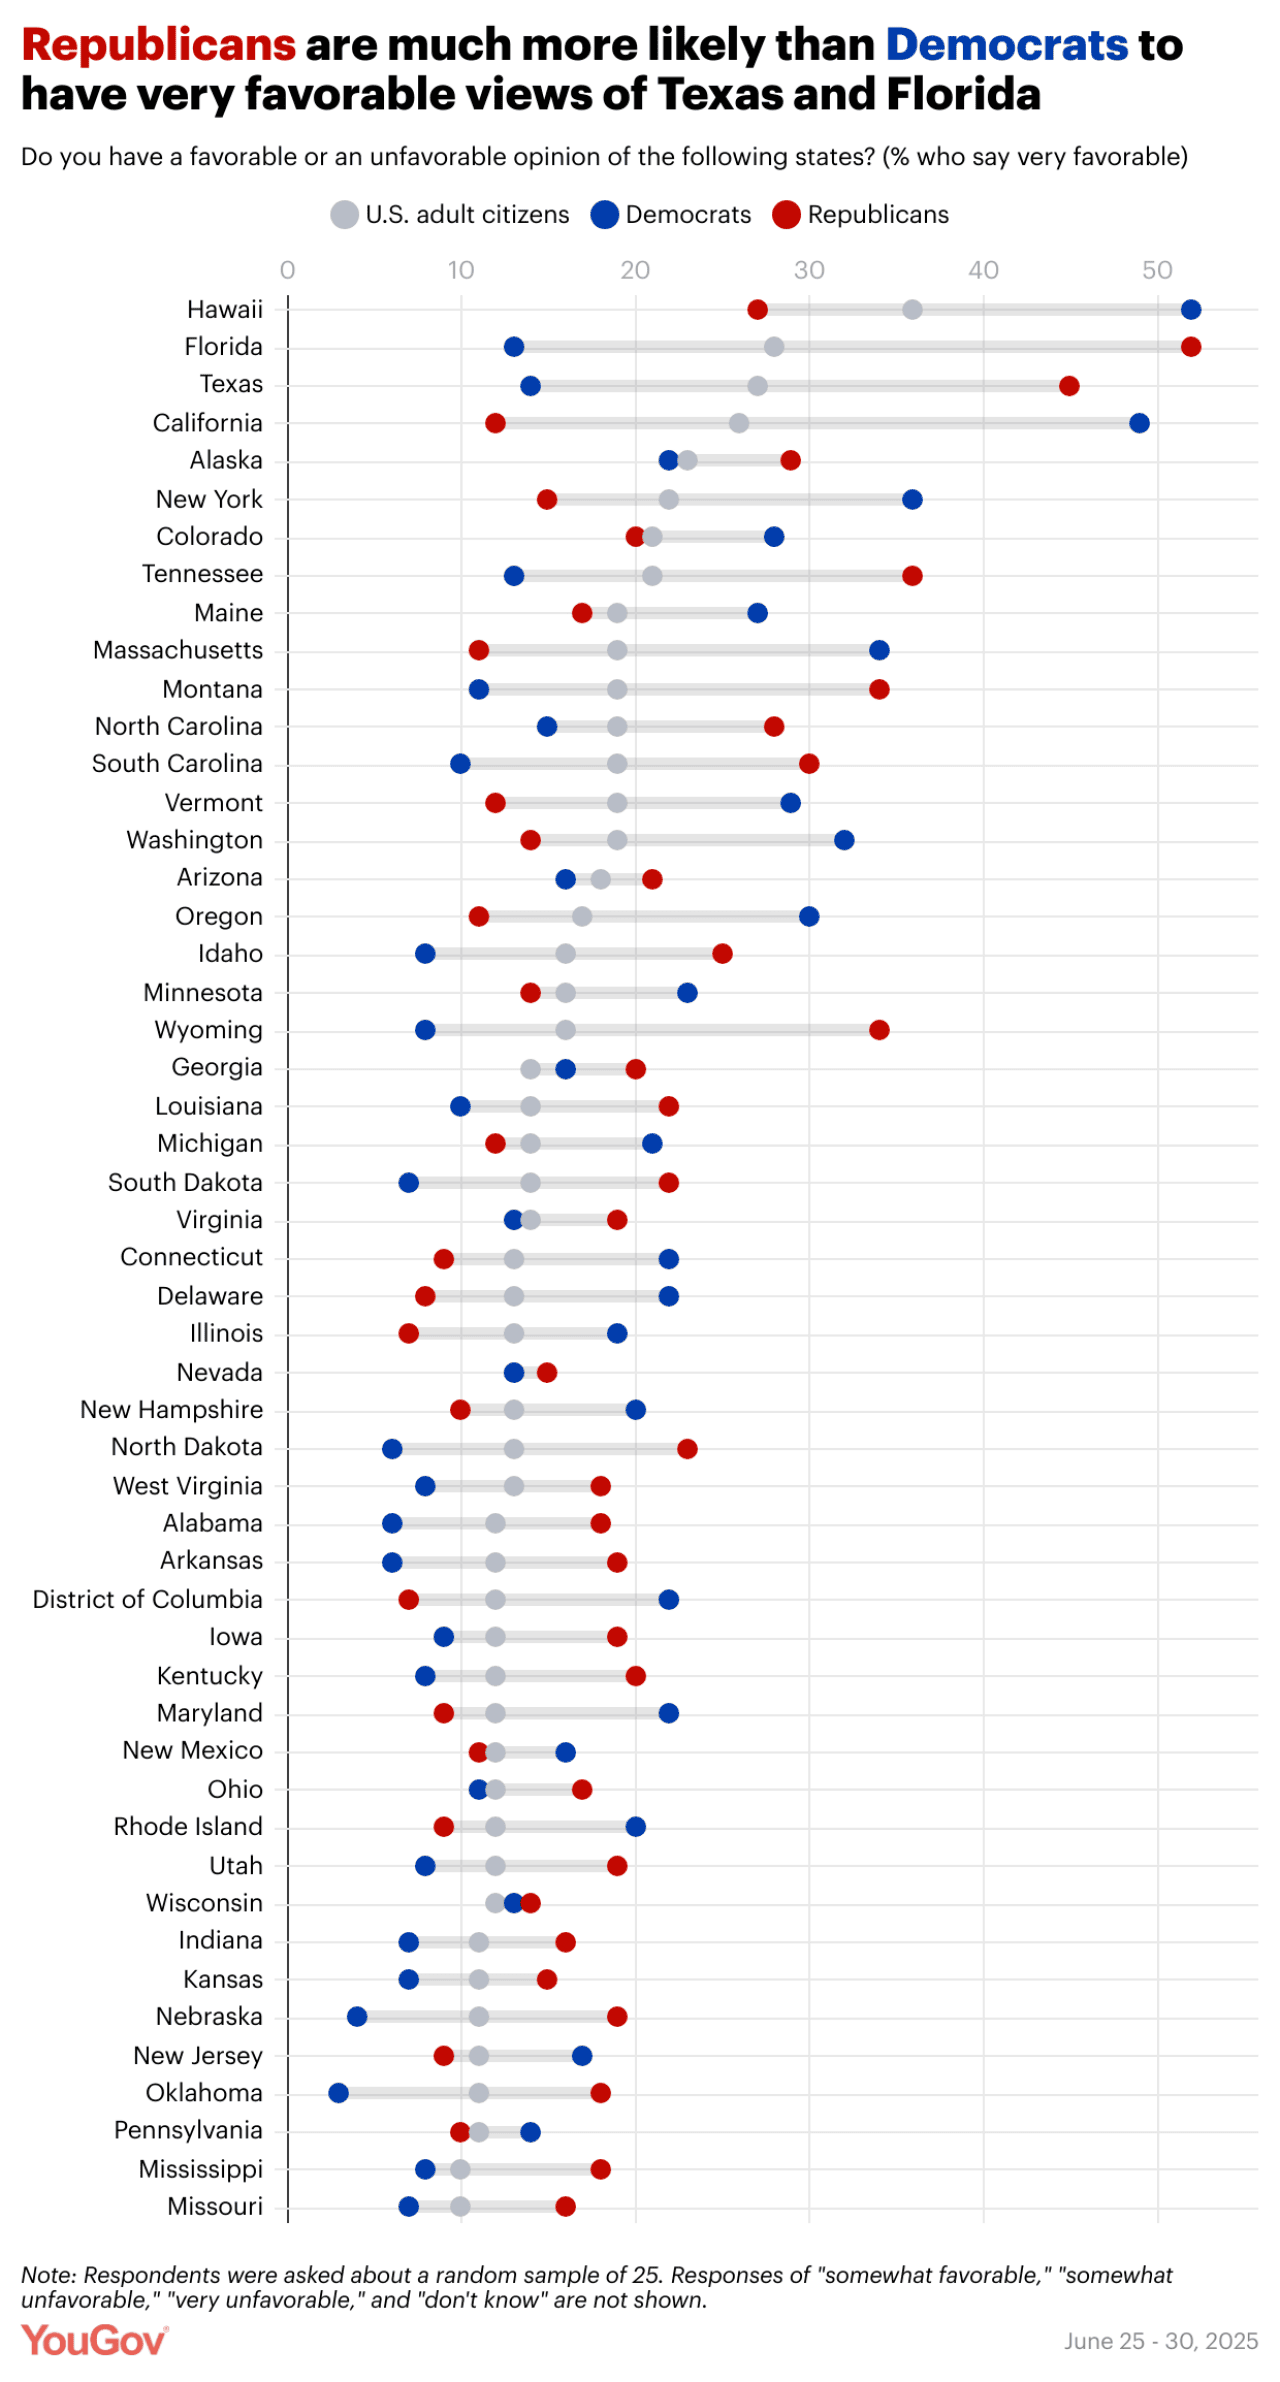
Democrats and Republicans have different views of several states, aligned with the partisan lean of those states. Among the biggest differences for Republicans:
- 52% of Republicans and 13% of Democrats have a very favorable view on Florida.
- 45% of Republicans and 14% of Democrats have a very favorable view of Texas.
- 34% of Republicans and 8% of Democrats have a very favorable view of Wyoming.
States that Democrats are more likely than Republicans to view very favorably are California (49% vs. 12%), Hawaii (52% vs. 27%), Massachusetts (34% vs. 11%) and New York (36% vs. 15%).
YouGov
Meanwhile, among the biggest differences in unfavorability:
- 57% of Republicans and 1% of Democrats view California very unfavorably.
- 34% of Republicans and 1% of Democrats view New York very unfavorably.
- 31% of Republicans and 3% of Democrats view the District of Columbia very unfavorably.
States that Democrats are more likely than Republicans to view very unfavorably include Florida (36% vs. 1%), Alabama (35% vs. 6%), and Texas (32% vs. 1%).
While the sample size in the poll for individual states is small — even for the most-populous states — it’s evident that people living in the biggest and oft-divisive states are more likely to view them favorably. Among people who live in California, 82% have a favorable view of the state, including 58% who have a very favorable view of it. Among people who live in Texas, 74% have a favorable view of it, including 49% who have a very favorable view of their state. Florida residents are more likely to have a favorable view than an unfavorable one (72% vs. 28%). New Yorkers are also more likely to have a favorable view of their state than an unfavorable one (79% vs. 20%).
Taylor Orth contributed to this article.
This story was produced by YouGov and reviewed and distributed by Stacker.
![]()


