The most dangerous roads on Labor Day Weekend
Drew Angerer // Getty Images
The most dangerous roads on Labor Day Weekend
If Labor Day weekend is anything like last year, more than half of all Americans will travel over the holiday weekend. Drivers should be diligent when hitting the road, as the holiday is one of the most dangerous days of the year for driving.
Using data from the National Highway Traffic Safety Administration, researchers at TruckInfo.net discovered a few worrying trends for Labor Day drivers.
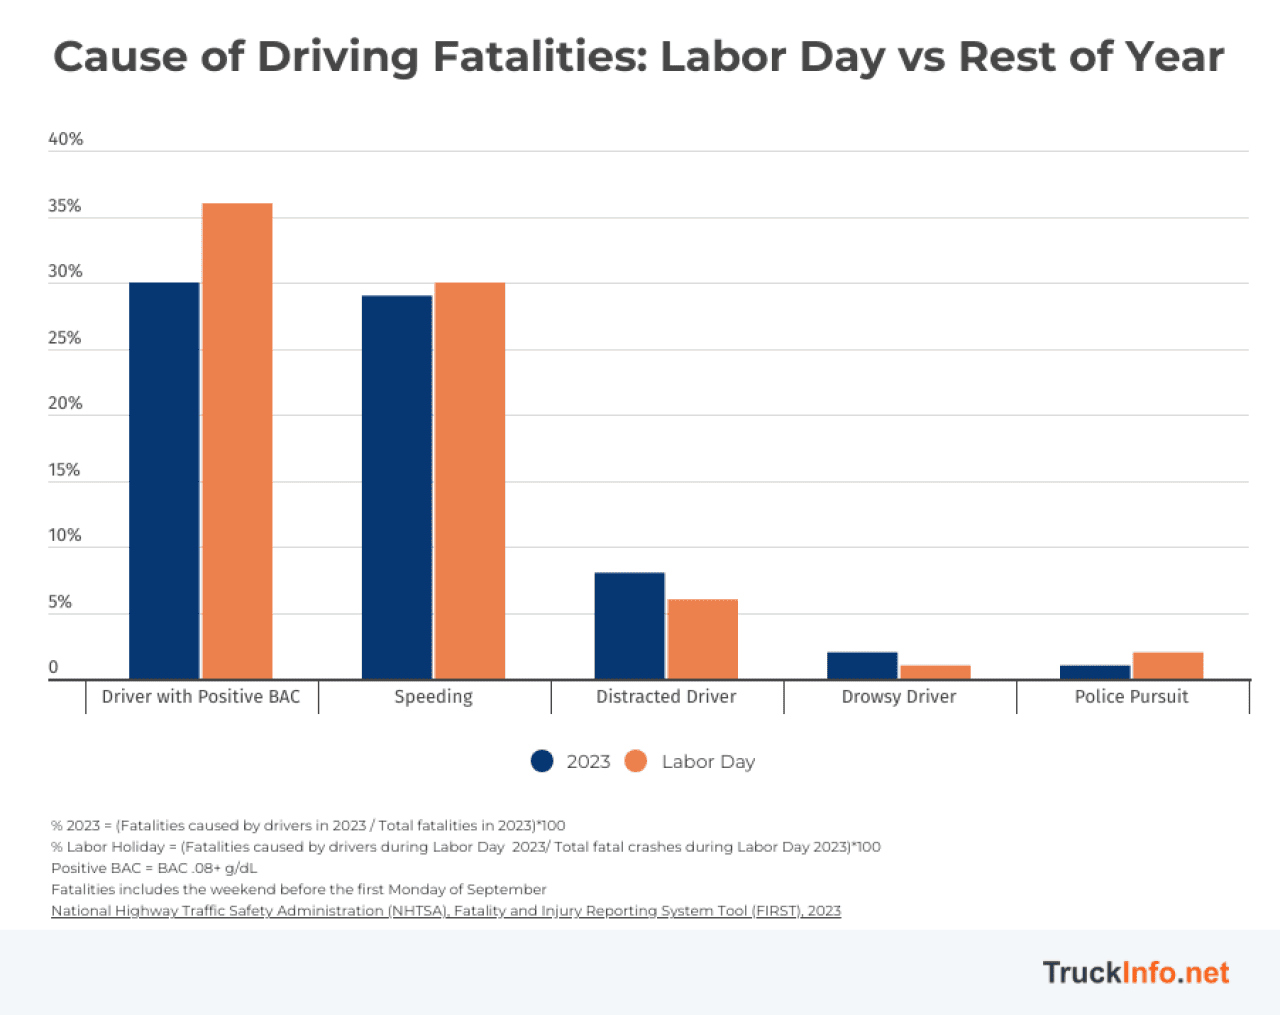
Drunk driving is a major issue over Labor Day weekend
Like many other holidays, drunk driving is a major issue over Labor Day weekend, and fatalities from drunk driving spike by nearly a fifth.
TruckInfo.net
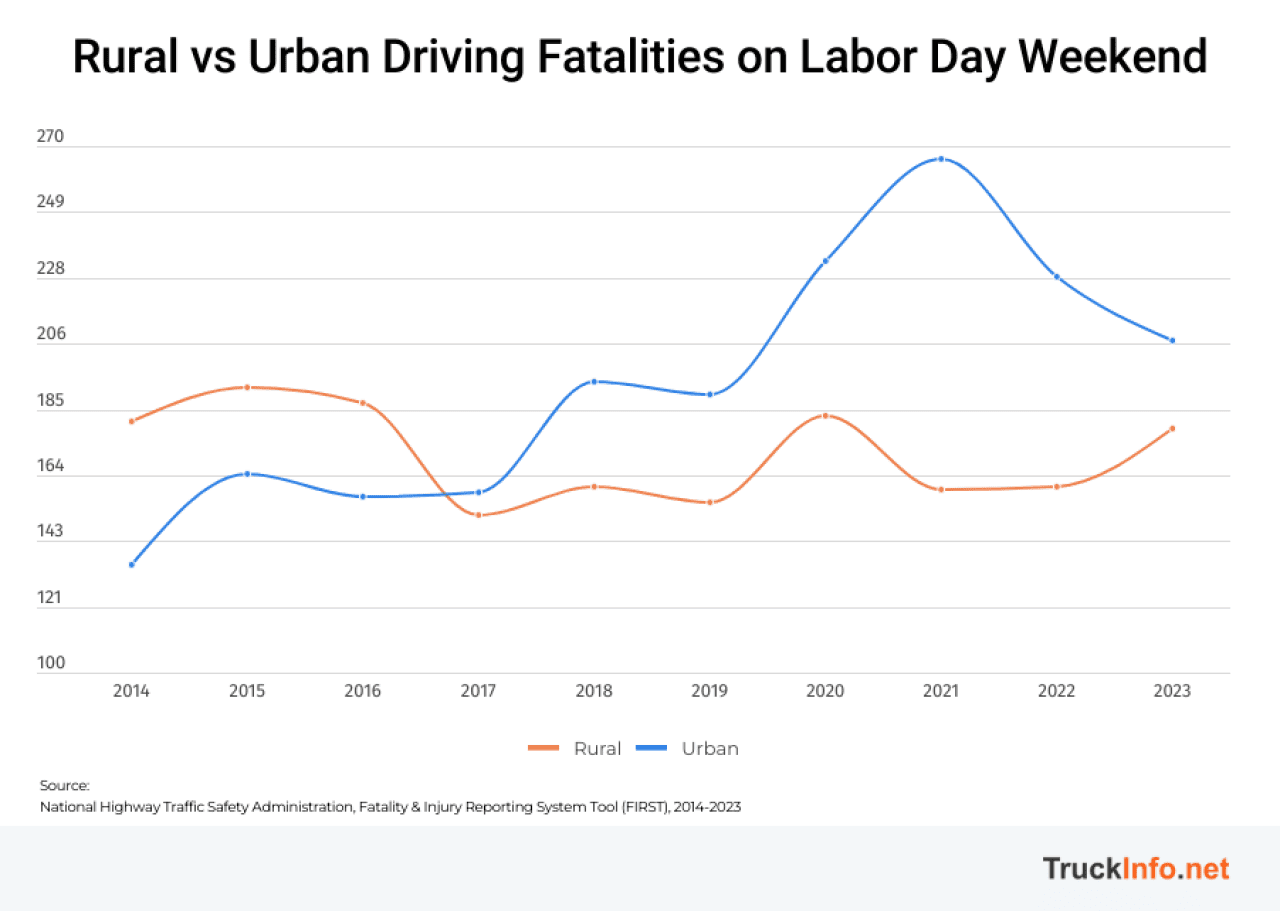
Labor Day driving fatalities in urban areas have spiked in recent years
Historically speaking, the majority of driving fatalities have occurred in rural areas. However, this trend reversed in 2017. Over the past decade, driving fatalities in urban areas have increased by 1.5 times.
TruckInfo.net
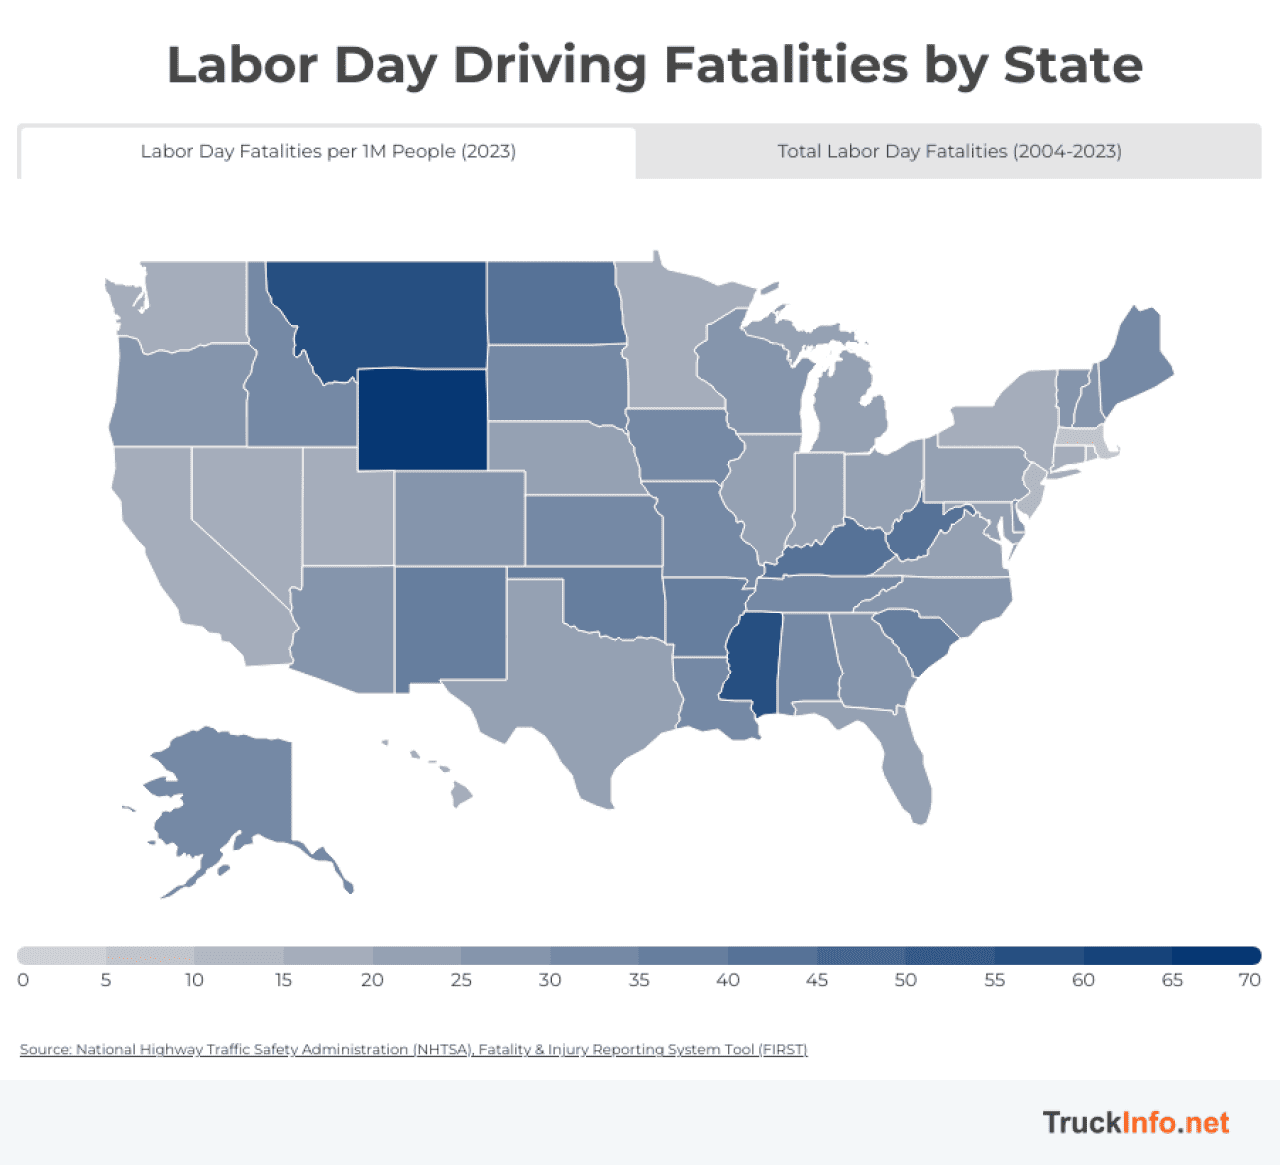
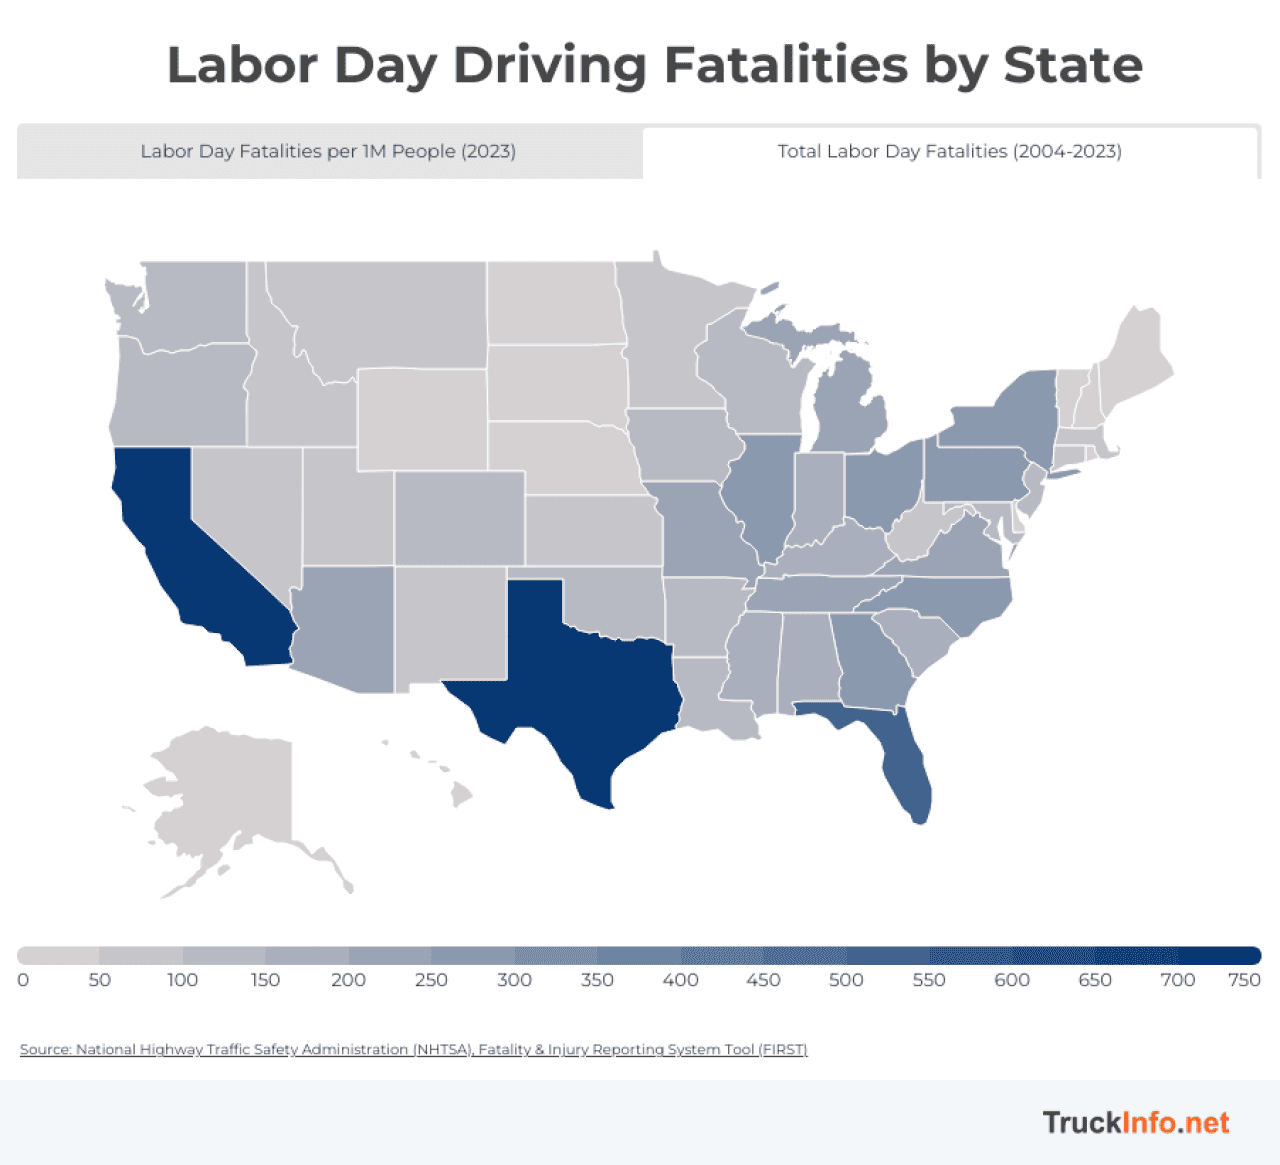
Wyoming, Montana, and Mississippi are the most dangerous states for driving over Labor Day weekend
While the majority of fatalities occur in urban areas, Wyoming, Montana, and Mississippi are the most dangerous states for driving — with nearly three times as many fatalities per capita as the U.S. as a whole. On the flip side, Massachusetts, New Jersey, and Washington have the fewest driving fatalities.
TruckInfo.net
TruckInfo.net
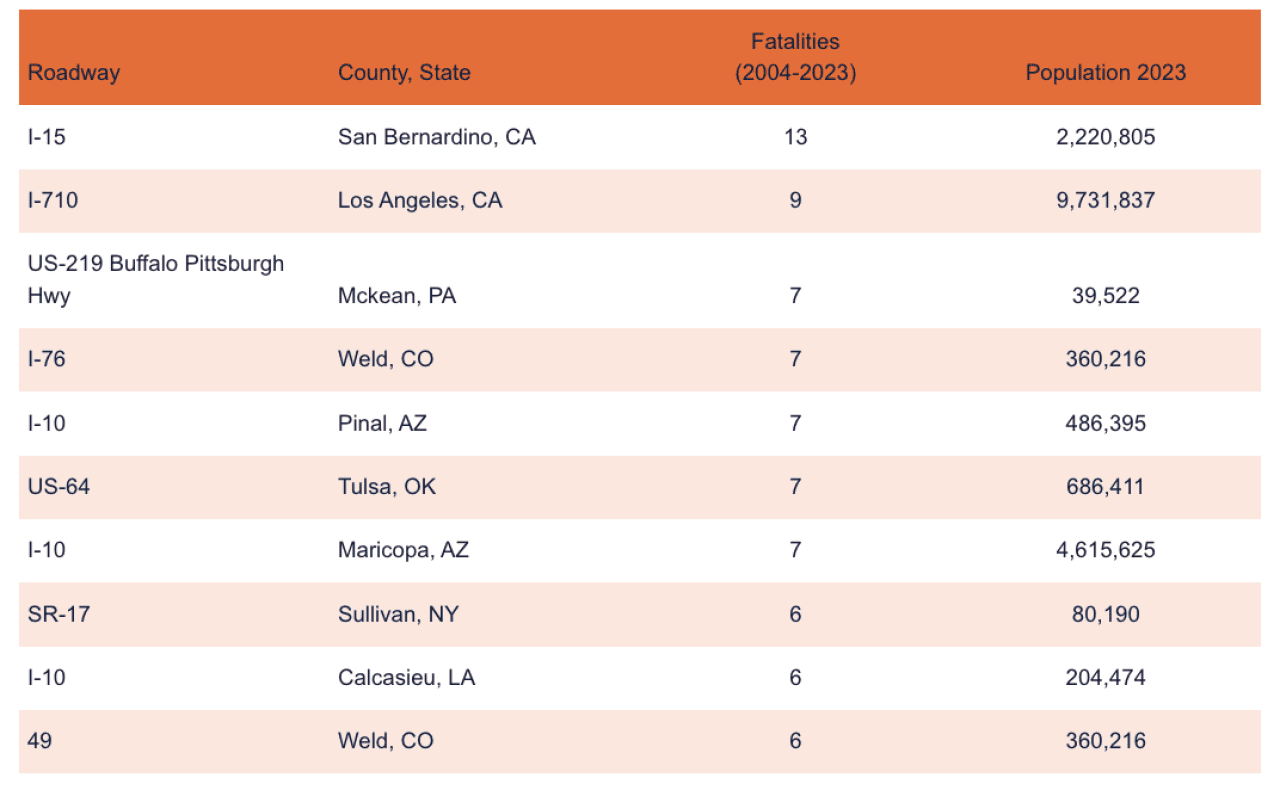
Six of the most dangerous roads are outside of populated metro areas
TruckInfo.net
The most dangerous counties for driving on Labor Day weekend from 2004 to 2023
TruckInfo.net
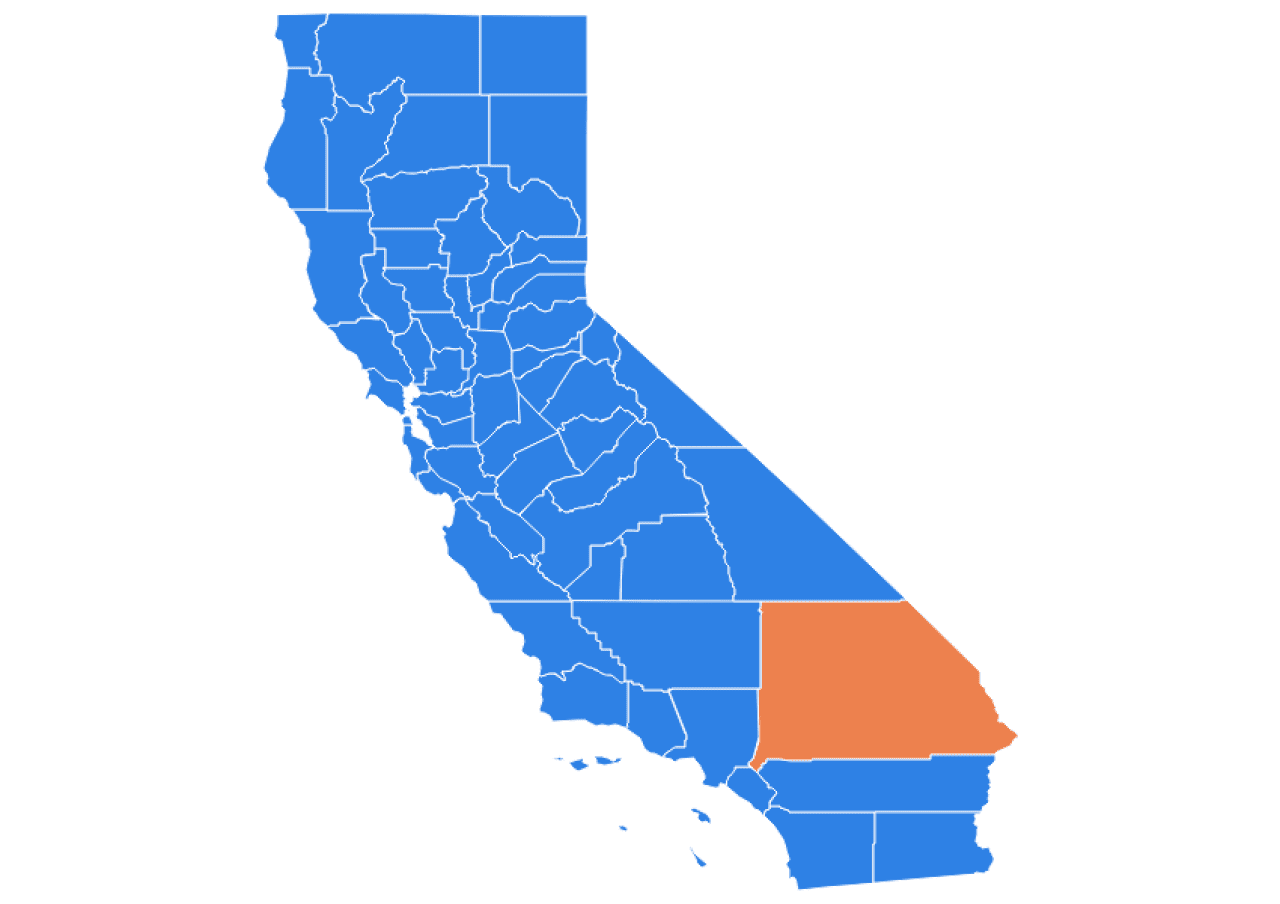
1. Los Angeles County, California
Labor Day Weekend Driving Fatalities: 140
Population: 9,731,837
TruckInfo.net
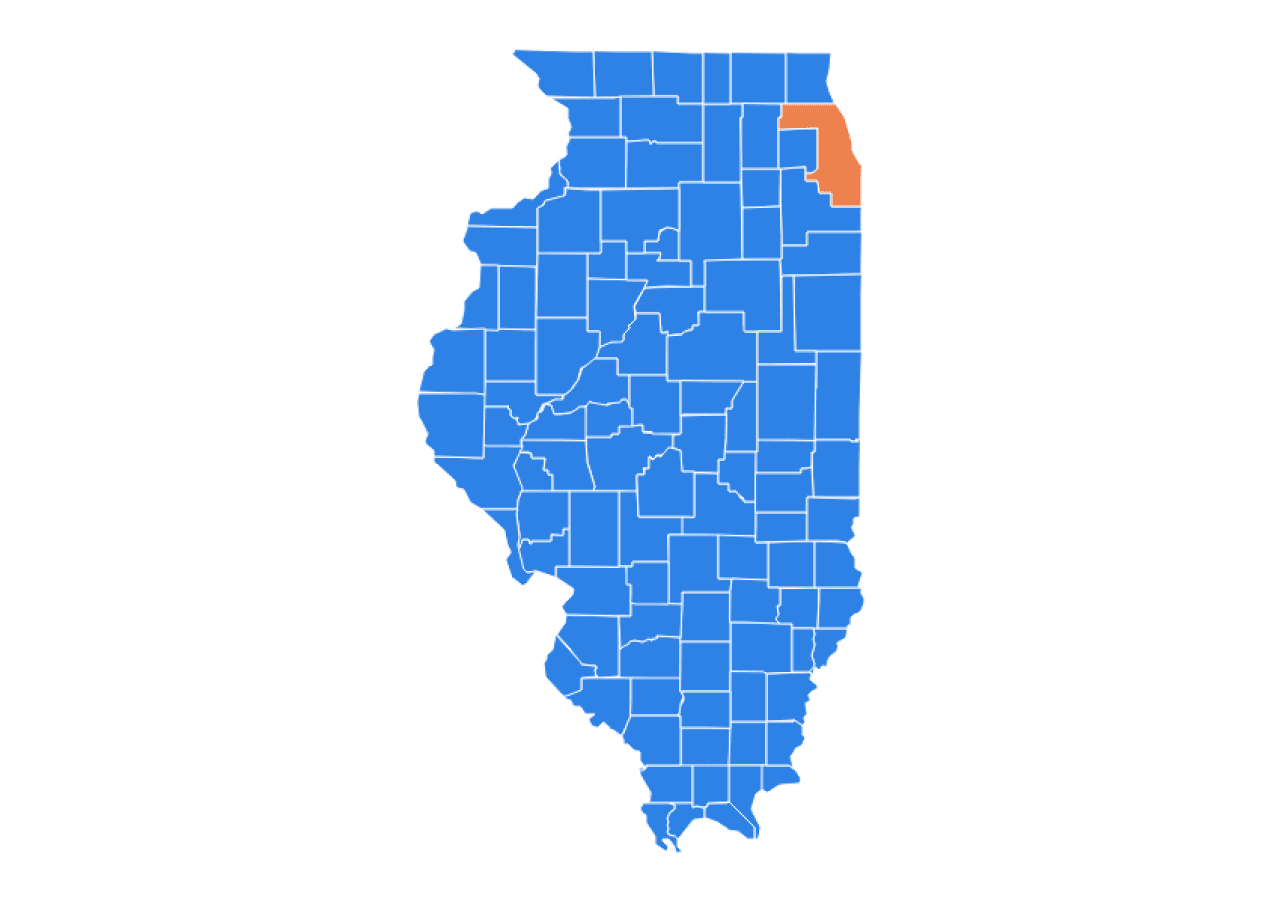
2. Cook County, Illinois
Labor Day Weekend Driving Fatalities: 81
Population: 5,142,522
TruckInfo.net
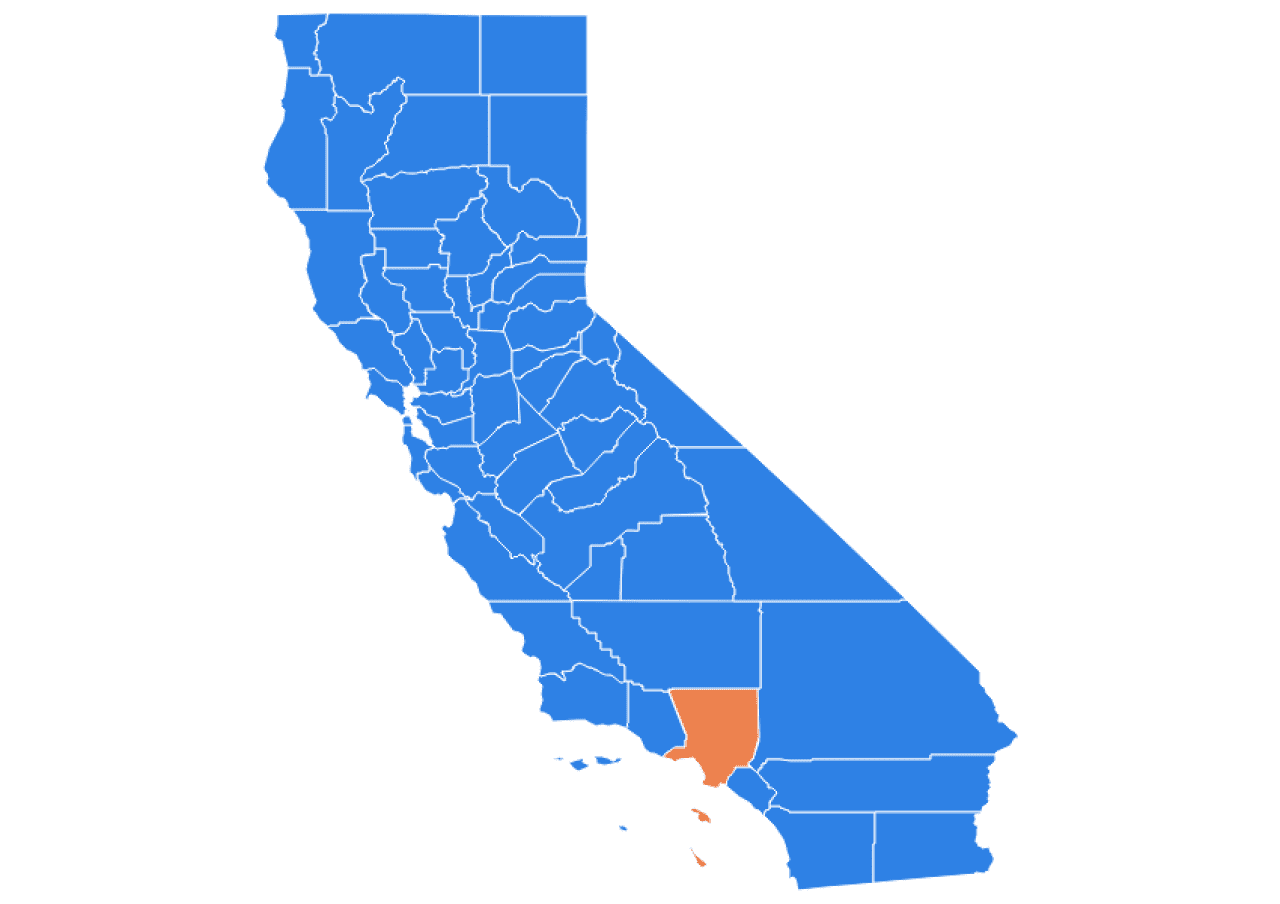
3. San Bernardino County, California
Labor Day Weekend Driving Fatalities: 76
Population: 2,200,805
TruckInfo.net
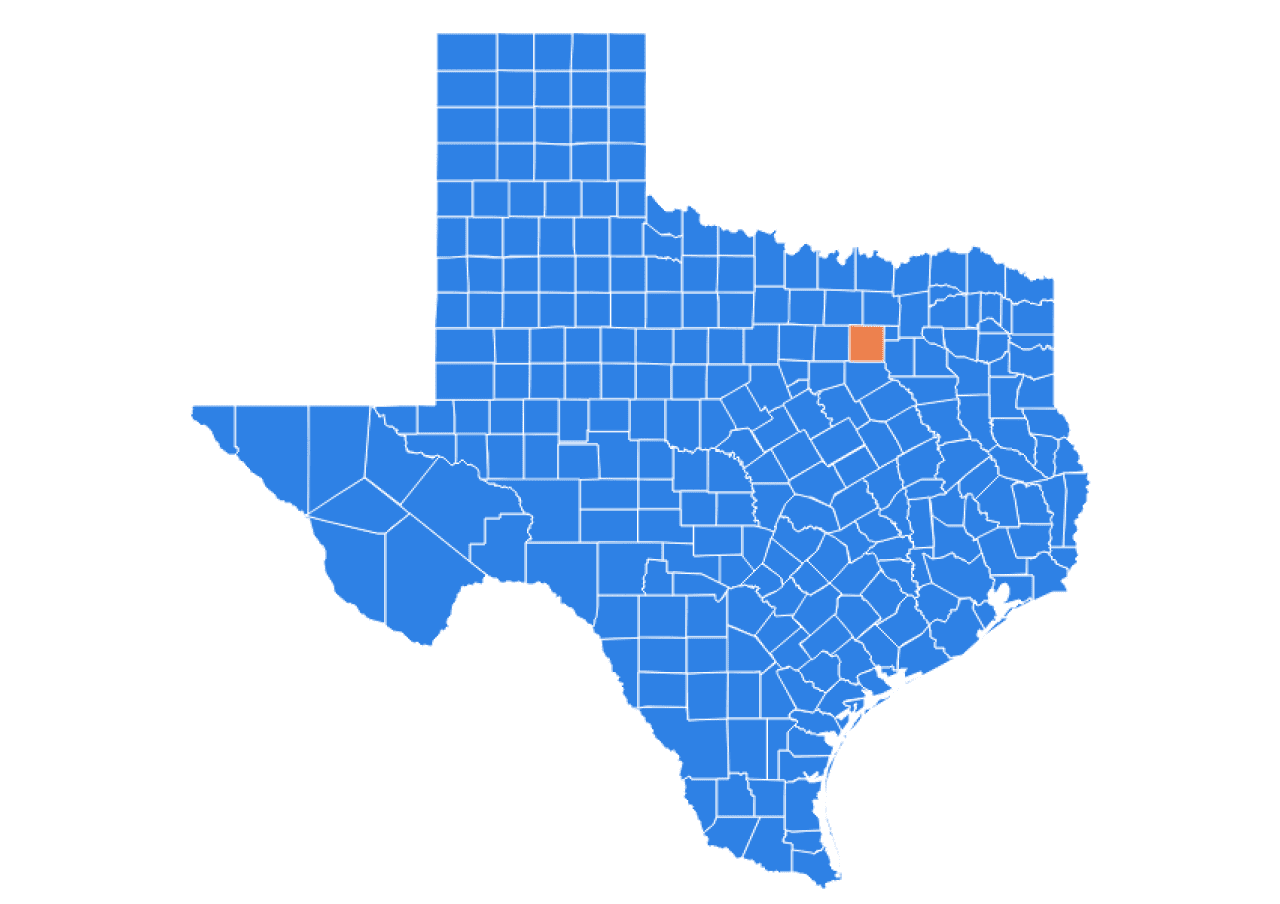
4. Dallas County, Texas
Labor Day Weekend Driving Fatalities: 75
Population: 2,636,254
TruckInfo.net
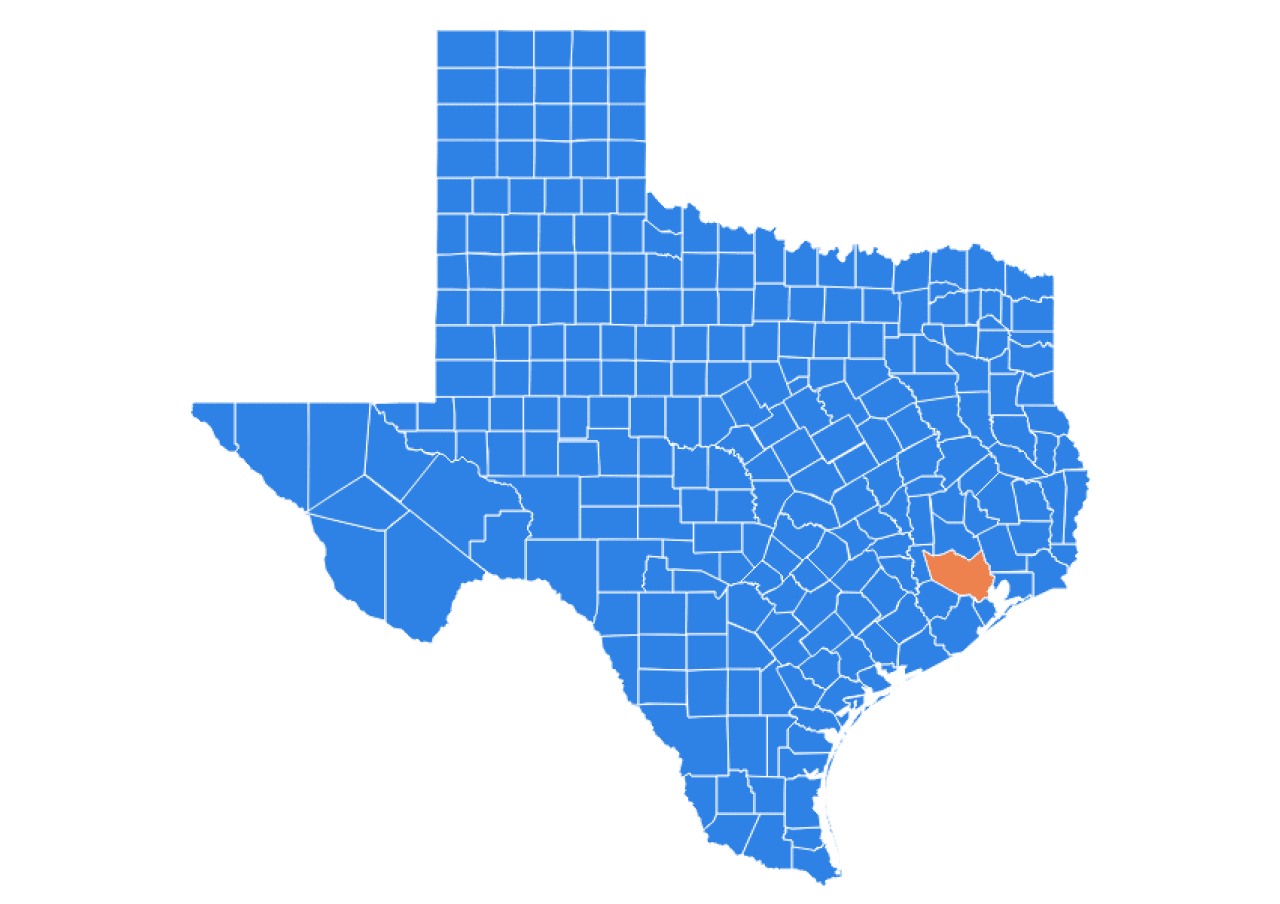
5. Harris County, Texas
Labor Day Weekend Driving Fatalities: 73
Population: 4,903,450
TruckInfo.net
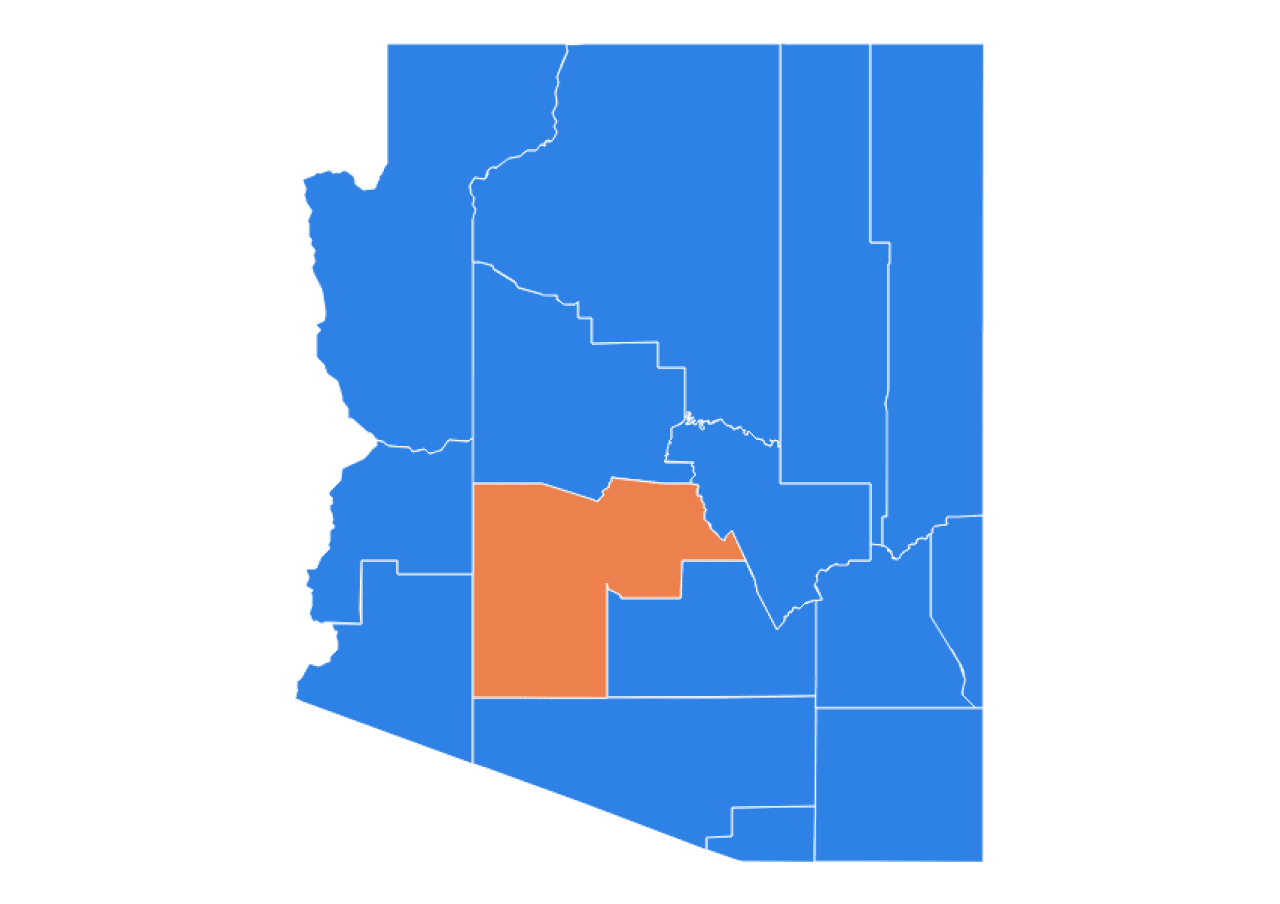
6. Maricopa County, Arizona
Labor Day Weekend Driving Fatalities: 62
Population: 4,615,625
TruckInfo.net
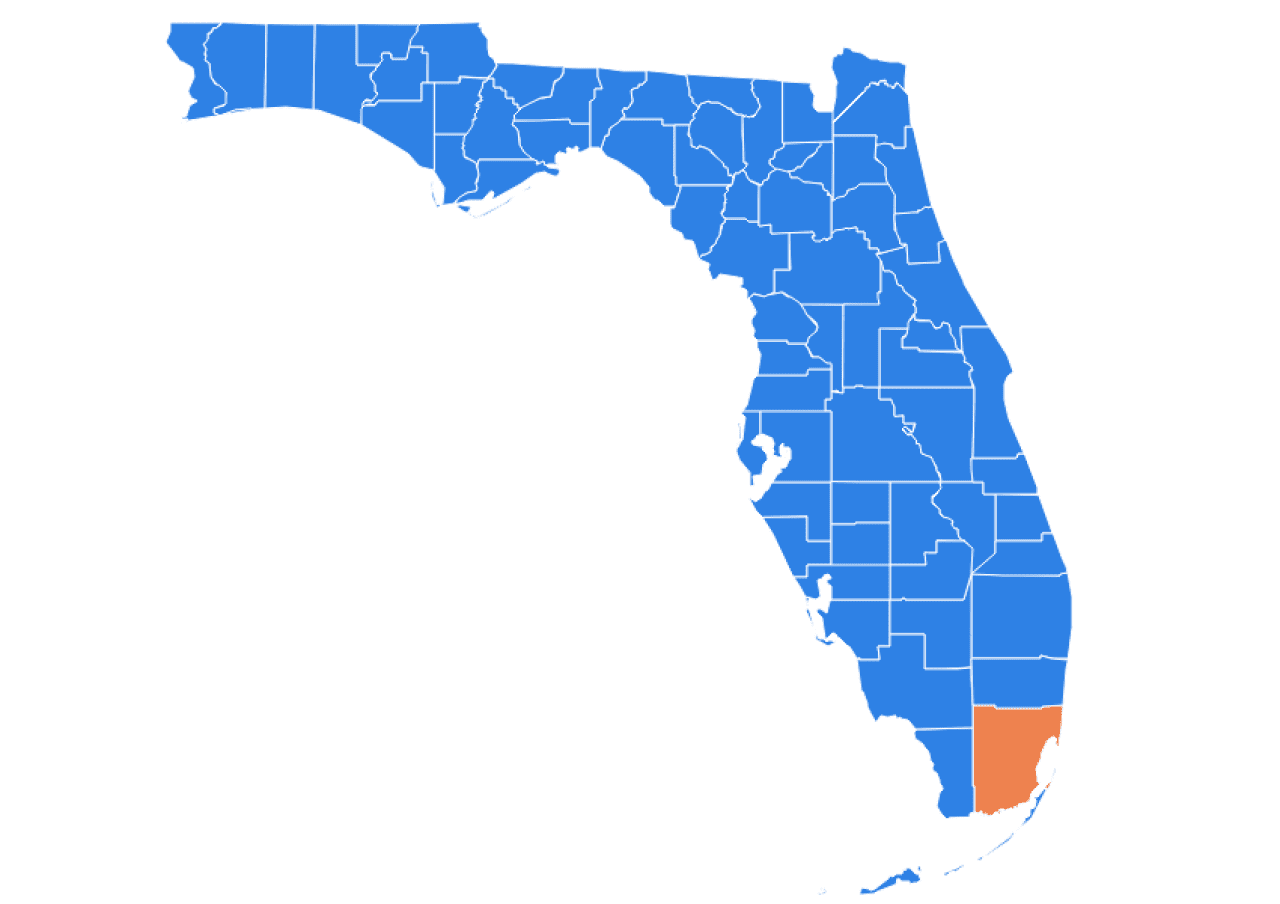
7. Miami-Dade County, Florida
Labor Day Weekend Driving Fatalities: 52
Population: 2,774,250
TruckInfo.net
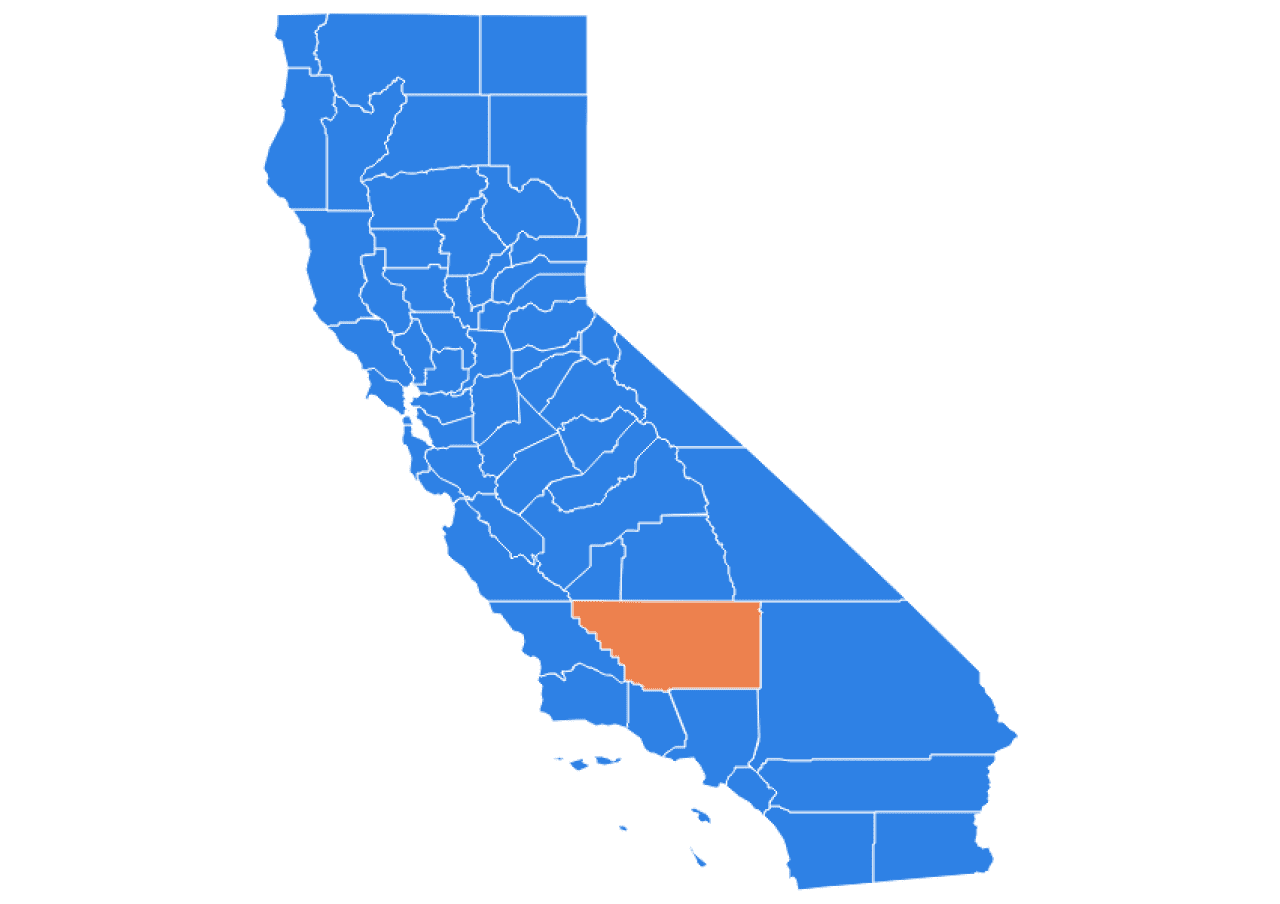
8. Kern County, California
Labor Day Weekend Driving Fatalities: 51
Population: 916,646
TruckInfo.net
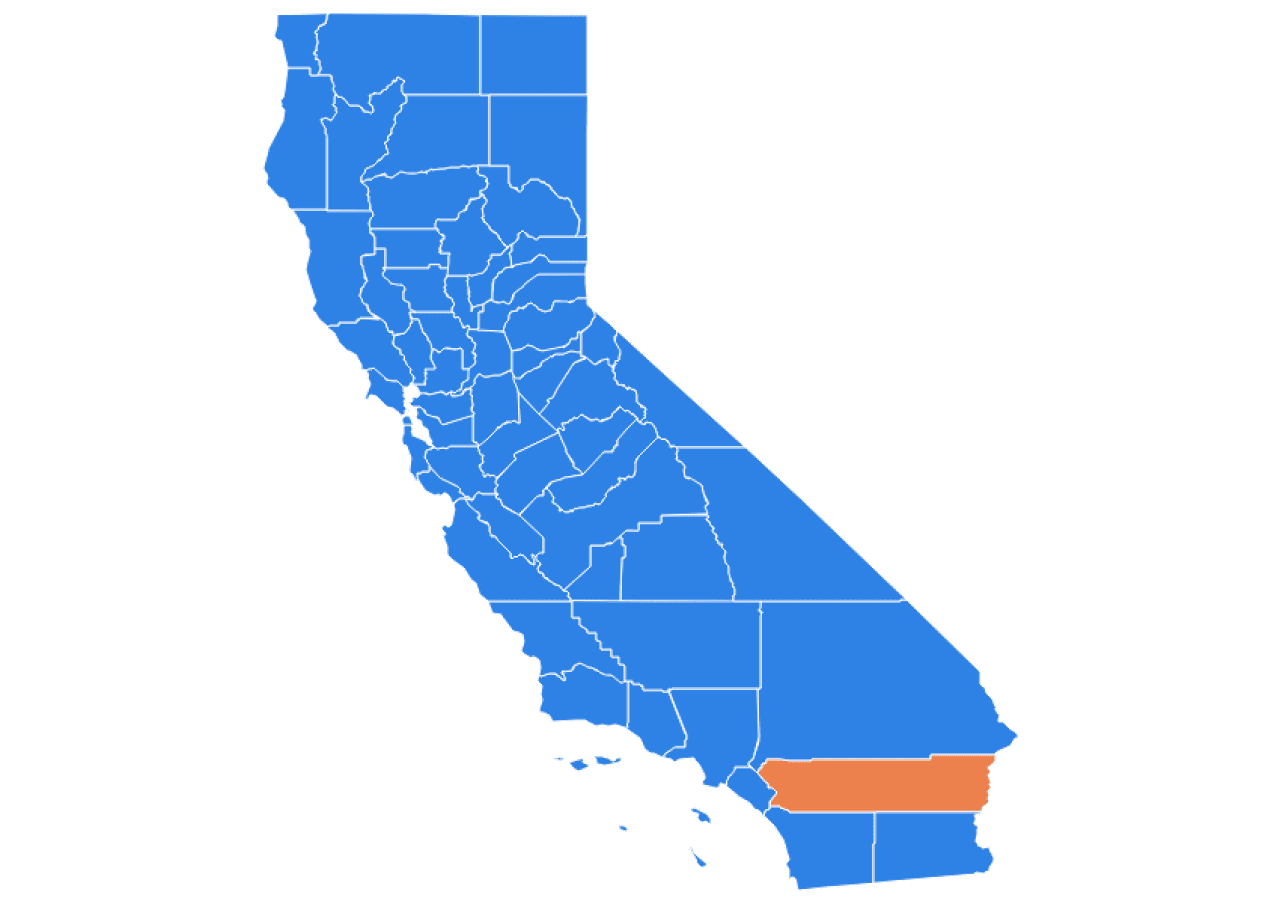
9. Riverside County, California
Labor Day Weekend Driving Fatalities: 51
Population: 2,503,549
TruckInfo.net
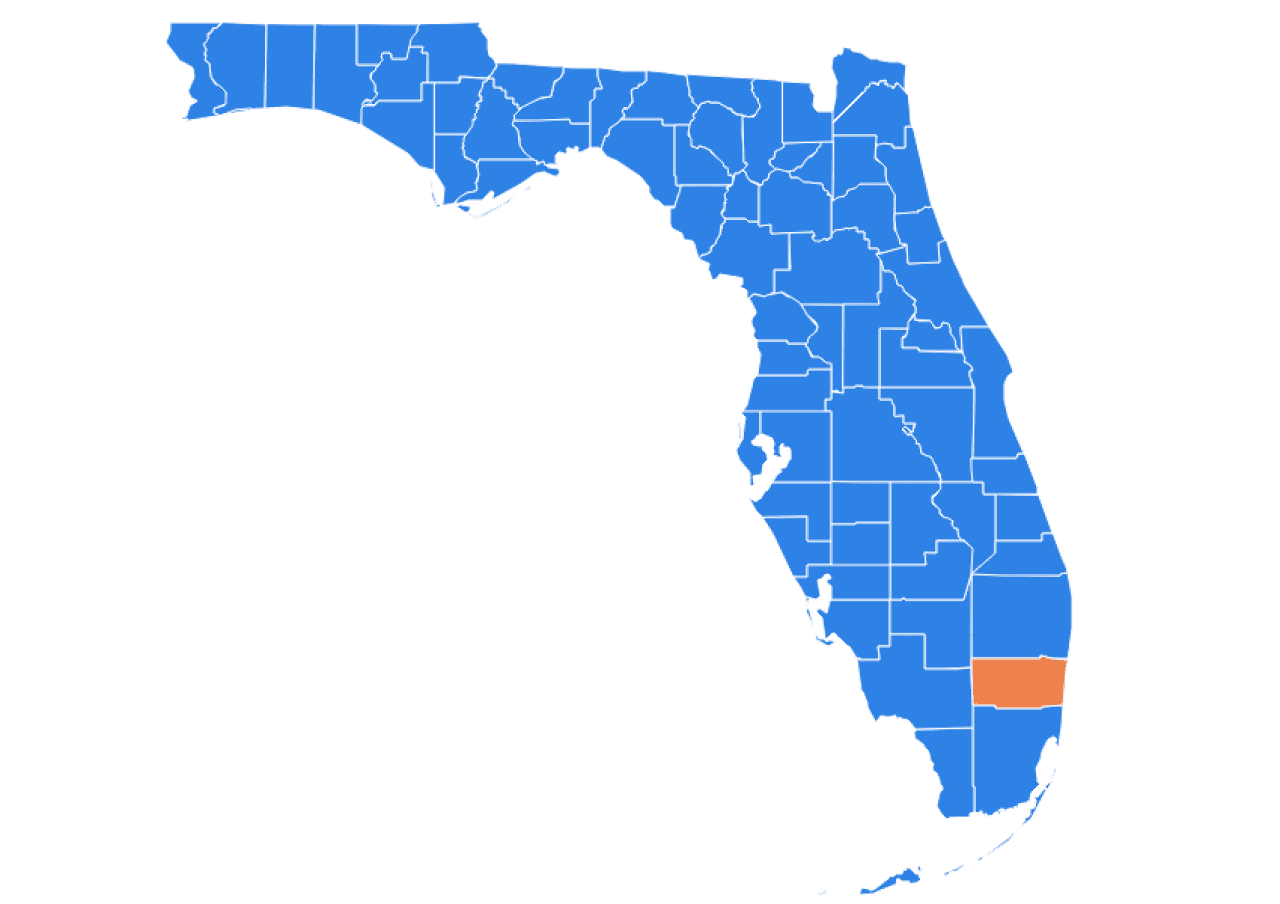
10. Broward County, Florida
Labor Day Weekend Driving Fatalities: 48
Population: 2,002,786
Full Data and Methodology
Fatal accident statistics were sourced from the National Highway Traffic Safety Administration for 2004 through 2023. Population data was sourced from the U.S. Census Bureau. Large counties were defined as those with populations greater than 500,000, midsize counties as those with populations between 150,000 and 500,000, and small counties as those with a population under 150,000.
Comparing Year over Year
In 2022, the average daily driving fatalities due to drunk driving were 29%, while on Labor Day alone, the rate rose to 38%—meaning that if there were 100 driving fatalities on Labor Day, 38 were caused by drunk driving. In 2023, the daily average inched up to 30%, while Labor Day’s rate dropped to 36%.
Over the decades, urban driving fatalities were nearly twice as high from 2013 to 2022, but from 2014 to 2023, the increase eased to about 1.5 times. In contrast, rural fatalities saw a much sharper decline over the same period.
The number of roads in less-populated metro areas (with under 500,000 residents) that made it to the top 10 most dangerous roads list increased from four in 2022 to six in 2023.
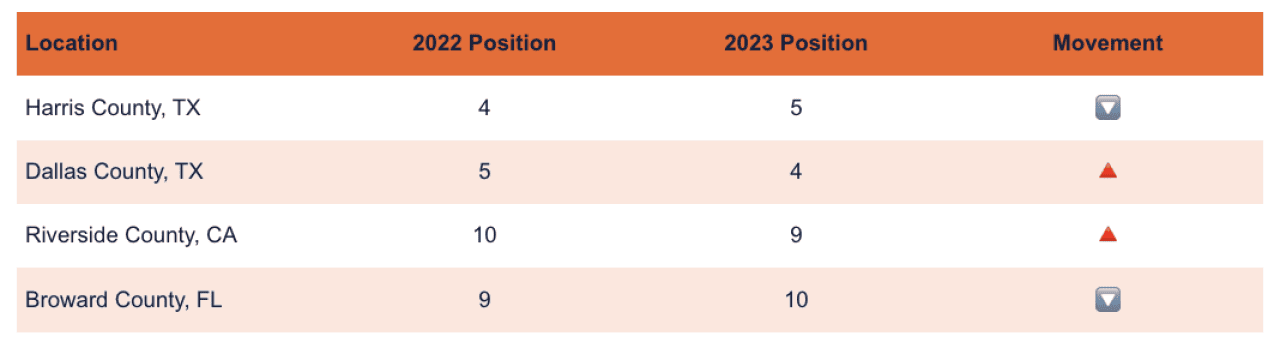
For the ranking of the most dangerous counties during Labor Day, Harris County, Texas, moved down from fourth place in 2022 to fifth place in 2023, swapping positions with Dallas County, Texas, which rose from fifth to fourth. Similarly, Riverside County, California, climbed from 10th to ninth, exchanging places with Broward County, Florida, which dropped from ninth to 10th.
TruckInfo.net
This story was produced by TruckInfo.net and reviewed and distributed by Stacker.
![]()


